Stocks Trading
On this page, you can find in-depth information about Stock Trading. Whether you're starting your journey with stocks or need advanced strategies for success, TradingSheets.com delivers the insights and strategies to elevate your stock trading game.
How To Start Trading In 15 Minutes
Introduction to Stock Trading
Stock trading is the buying and selling of shares in companies with the aim of making short-term profits. Unlike investing, where individuals buy stocks to hold them for long periods, often years or decades, stock trading focuses on capitalizing on short-term market movements. Traders may hold stocks for just minutes, hours, or days, always looking for opportunities to profit from price fluctuations.
In 2024, stock trading has evolved into a fast-paced and highly technical field, where traders rely on data, patterns, and trends to make quick decisions. One of the key tools in a trader’s arsenal is technical analysis, which helps traders predict future price movements based on historical data and market psychology, rather than traditional stock performance indicators like earnings reports or balance sheets.
Trading vs. Investing: What’s the Difference?
Investing and trading are often confused, but they are quite different strategies with distinct goals and timeframes.
| Aspect | Investing | Trading |
|---|---|---|
| Timeframe | Long-term (years to decades) | Short-term (minutes to months) |
| Goal | Build wealth gradually over time by holding stocks | Profit from short-term price movements |
| Risk Tolerance | Typically lower, with a focus on minimizing risk | Higher, with a willingness to take on more risk |
| Analysis Focus | Fundamental analysis (company financials, growth) | Technical analysis (charts, trends, patterns) |
| Approach | Buy and hold, patience is key | Buy and sell quickly, timing is critical |
Investing is about building wealth steadily over time by choosing stocks based on company performance, economic outlook, and future growth potential. Investors tend to ignore short-term price fluctuations, focusing instead on the long-term appreciation of the stock’s value.
Trading, on the other hand, is much more focused on the short term. Traders aim to make profits quickly, buying and selling based on small price changes that can happen within minutes, hours, or days. The main objective is to catch these price fluctuations and capitalize on them, requiring precise timing, speed, and a deep understanding of market trends and technical analysis.
Understanding Technical Analysis in Stock Trading
Technical analysis is a method used to evaluate stocks by analyzing statistical trends from trading activity, such as price movement and volume. Unlike fundamental analysis, which looks at a company’s earnings, expenses, assets, and liabilities, technical analysis is purely focused on price charts and market patterns.
Key Principles of Technical Analysis:
- Price Discounts Everything: The market price reflects all relevant information, so by studying price movement, traders can understand everything they need to know about a stock.
- Prices Move in Trends: Stocks tend to move in predictable trends over time, whether upward (bullish), downward (bearish), or sideways (neutral). Recognizing these trends early can help traders enter and exit the market at the right time.
- History Repeats Itself: Patterns in stock charts often repeat, giving traders a basis for predicting future price movements by analyzing historical trends.
Popular Chart Patterns in Stock Trading
One of the most critical aspects of technical analysis is recognizing chart patterns, which are visual representations of price movements that traders use to predict future behavior. Here are some of the most popular patterns traders rely on:
Head and Shoulders Pattern
This is a reversal pattern that signals a change in trend direction. It consists of three peaks: a higher peak (the “head”) flanked by two lower peaks (the “shoulders”). When the stock breaks below the “neckline” connecting the two troughs between the peaks, it usually signals a bearish trend reversal.
Double Top and Double Bottom
These are also reversal patterns. A double top occurs when a stock reaches the same high twice before reversing downward, indicating a bearish reversal. A double bottom is the opposite, where a stock reaches the same low twice and then begins to rise, signaling a bullish reversal.
Triangles
Triangles are continuation patterns that show a period of consolidation before the price breaks out in the direction of the prior trend. There are three types:
- Ascending Triangle: Typically bullish, this pattern shows higher lows and a flat resistance level.
- Descending Triangle: Typically bearish, this pattern features lower highs and a flat support level.
- Symmetrical Triangle: This pattern can break in either direction, and traders watch for a breakout to determine the trend.
Flags and Pennants
Flags and pennants are short-term continuation patterns that appear after a sharp price movement (upward or downward). They indicate that the stock is taking a brief pause before continuing in the same direction. Flags resemble small rectangles, while pennants are small symmetrical triangles.
Cup and Handle
This bullish continuation pattern resembles the shape of a tea cup. The “cup” is a rounded bottom, and the “handle” is a small consolidation phase that follows before a breakout to the upside. It indicates a strong upward trend after the breakout.
Using Technical Indicators for Stock Trading
In addition to chart patterns, traders rely on technical indicators—mathematical calculations based on price, volume, or other market data—to make more informed trading decisions. Here are some widely used indicators in stock trading:
Moving Averages (MA)
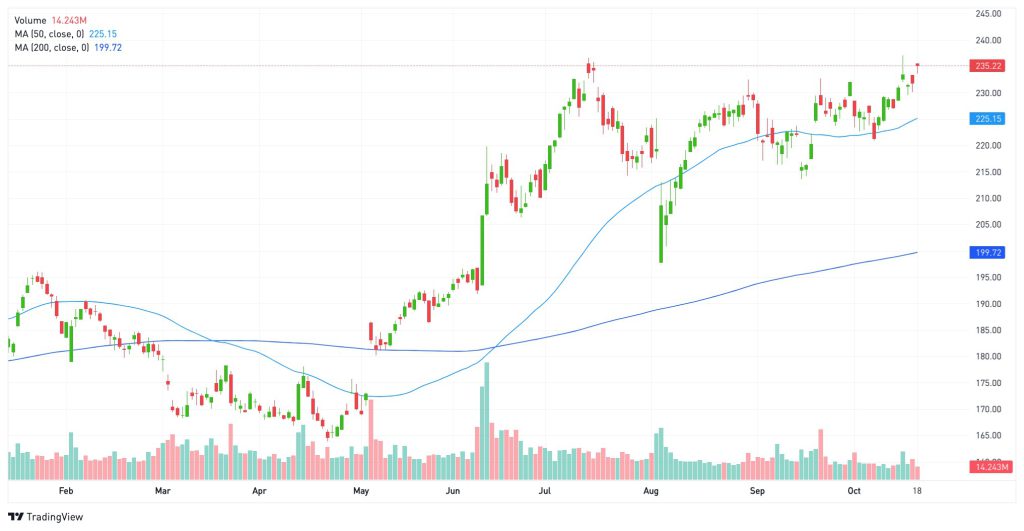
A moving average smooths out price data to help traders identify the overall direction of the trend. Traders often use two types:
- Simple Moving Average (SMA): A basic average of a stock’s closing prices over a specific period.
- Exponential Moving Average (EMA): Puts more weight on recent prices, making it more responsive to new data.

Bollinger Bands
Bollinger Bands are a volatility indicator consisting of a middle band (a moving average) and two outer bands. These bands expand and contract based on market volatility. When prices hit the upper band, the stock may be overbought; when prices hit the lower band, the stock may be oversold.
MACD (Moving Average Convergence Divergence)
The MACD is a trend-following momentum indicator that shows the relationship between two moving averages of a stock’s price. It helps traders identify bullish and bearish market conditions and potential reversals.
Relative Strength Index (RSI)
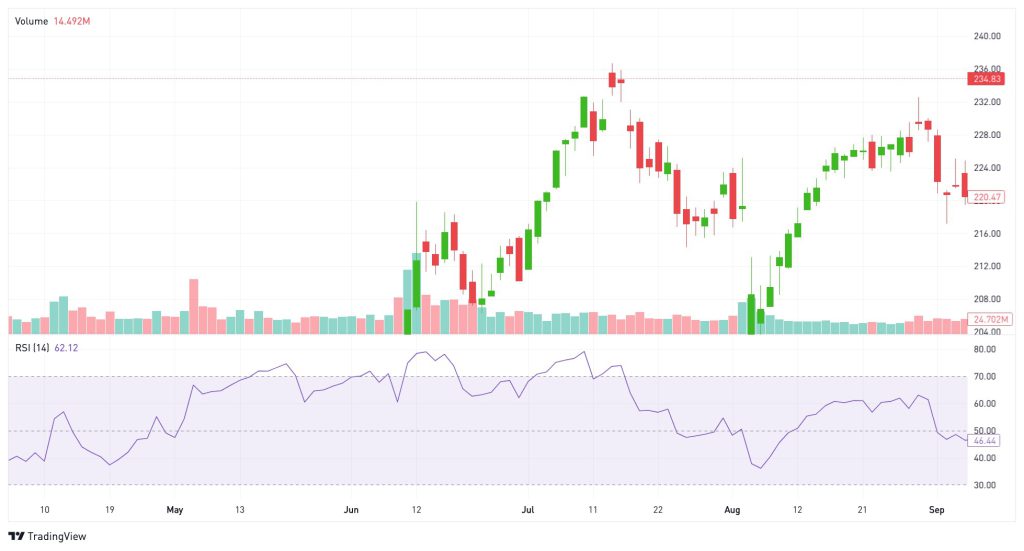
The RSI is a momentum oscillator that measures the speed and change of price movements. It ranges from 0 to 100, with values above 70 indicating overbought conditions and values below 30 indicating oversold conditions.

Risk Management in Stock Trading
Trading stocks comes with substantial risk, particularly when focusing on short-term profits. As a trader, it’s essential to implement strong risk management strategies to avoid significant losses.
Setting Stop-Loss Orders
A stop-loss order automatically sells your position if the stock hits a certain price, limiting your losses. It’s one of the most basic and important tools for managing risk in stock trading.
Calculating Risk-Reward Ratios
Before entering a trade, traders calculate the risk-reward ratio to determine if the potential profit is worth the risk. A common rule is to aim for at least a 1:2 risk-reward ratio, meaning the potential profit is at least twice as much as the potential loss.
Conclusion: Is Stock Trading Right for You?
Stock trading can be a rewarding but challenging endeavor. It requires a solid understanding of technical analysis, chart patterns, and market indicators to make informed decisions. Unlike long-term investing, which focuses on slow and steady growth, stock trading is fast-paced, with traders capitalizing on short-term price movements. This short-term nature demands strong discipline, emotional control, and the ability to act quickly on market trends.
If you’re someone who enjoys analyzing data, monitoring market trends, and making swift decisions, stock trading might be the right fit for you. However, it’s essential to educate yourself, practice with demo accounts, and start with smaller trades to minimize risk.
By mastering technical analysis, understanding market psychology, and implementing strong risk management strategies, you can set yourself up for success in the exciting world of stock trading.
Start Your Trading Journey with TRADE.com
Open a Real Money Account
Sign up with TRADE.com and start trading Stocks Trading with as little as $100.
Open a Real AccountOR
Practice with a Demo Account
Not ready to trade with real money? Start practicing with TRADE.com’s demo account.
Open a Demo Account


