Candlestick charts are one of the most popular tools in trading. If you’ve ever looked at a trading screen, you’ve probably seen them—a series of red and green “candles” that tell a story about price movement. These charts are a powerful way to understand what’s happening in the market at a glance.
Candlestick patterns help traders by giving clues about what might happen next. They reflect market sentiment—whether traders are feeling optimistic (bullish) or pessimistic (bearish)—and can provide important insights when you’re deciding when to enter or exit a trade.
What Are Candlestick Patterns?
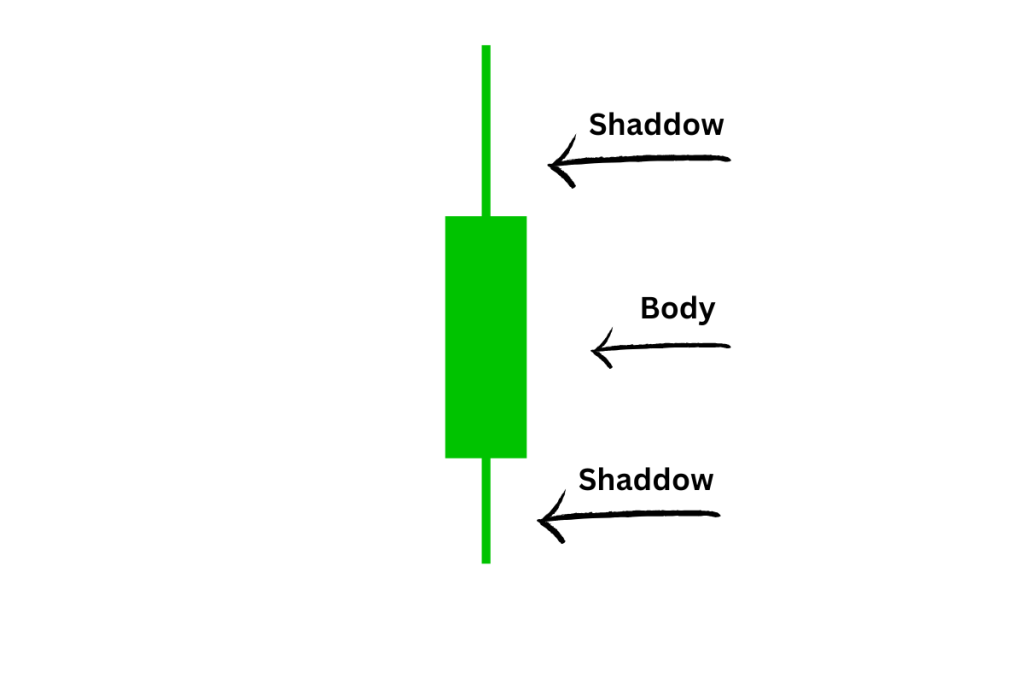
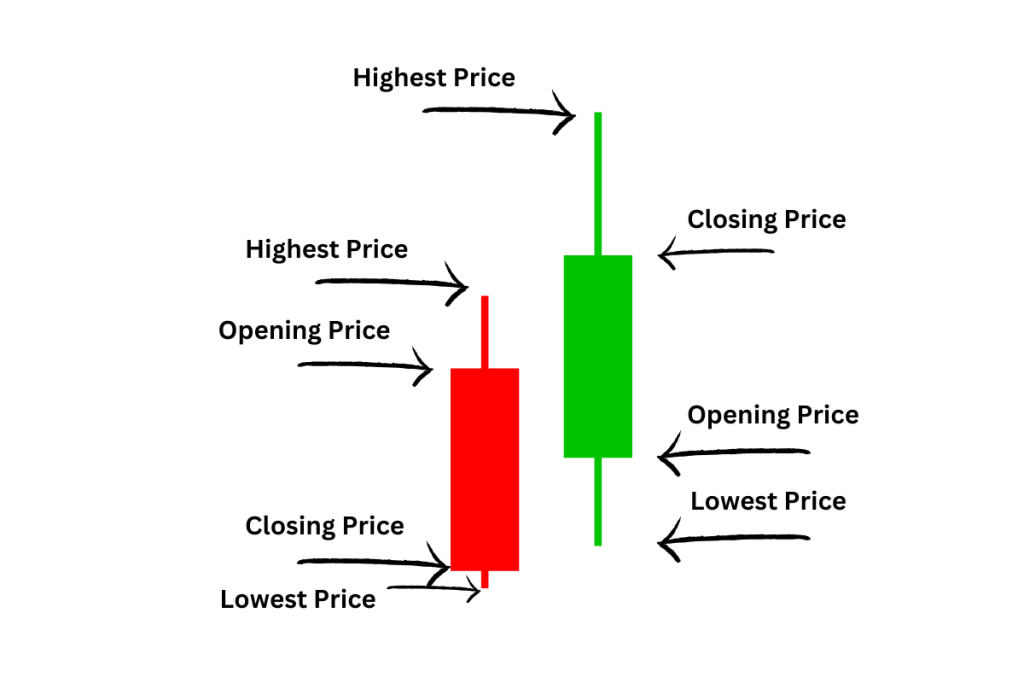
A candlestick pattern is simply a visual representation of price action over a specific time frame. Each candlestick shows the opening, closing, highest, and lowest prices within that period. The body of the candle represents the range between the open and close, while the thin lines (or “wicks”) show the high and low.

Here’s a quick breakdown:
- Body: The thick part of the candle. If the body is green (or white, depending on the platform), the price closed higher than it opened. If it’s red (or black), the price closed lower than it opened.
- Wicks (or shadows): The lines above and below the body, showing the highest and lowest prices reached during that time.
- Color: Green (or white) means the price moved up, while red (or black) means it moved down.
Each candlestick reflects a single time period, whether it’s a minute, an hour, or a day. For example, if you’re looking at a daily chart, each candle represents a single trading day.
Candlestick patterns are popular because they’re simple to read and pack a lot of information into a small space. By just looking at a chart, you can quickly get a sense of whether buyers or sellers are in control and spot potential changes in market direction.
How to Read a Candlestick
Reading a candlestick is pretty straightforward once you understand the key elements: open, high, low, and close prices.

- Open Price: The price at which the asset began trading during the time period the candle represents.
- High Price: The highest price reached during the period.
- Low Price: The lowest price reached during the period.
- Close Price: The final price at the end of the period.
If the price closed higher than it opened, you’ll see a green (or white) candle, signaling a bullish move. This means that buyers were in control, pushing the price up. If the price closed lower than it opened, the candle will be red (or black), indicating a bearish move—sellers were in control and pushed the price down.
The length of the body shows the strength of the price movement. A long body means there was a significant difference between the open and close, indicating strong buying or selling pressure. A short body suggests there wasn’t much movement during that time, indicating indecision or consolidation.
The wicks (shadows) provide additional clues. If a candle has long wicks but a short body, it means that while the price fluctuated during the period, it ended up near where it started. This can signal indecision or a potential reversal. In contrast, a candle with short wicks and a long body shows strong momentum in one direction.
Key Candlestick Patterns Every Trader Should Know
Now that you know how to read a single candlestick, let’s look at some of the most common candlestick patterns. These patterns can help traders identify potential market reversals or trends.
- Doji: A Doji forms when the open and close prices are almost the same, creating a candle with a very short body and long wicks. This pattern signals indecision in the market—neither buyers nor sellers are in control. It often appears before a potential market reversal or after a period of consolidation.
- Hammer: A hammer is a bullish reversal pattern that appears after a downtrend. It has a small body with a long lower wick, indicating that sellers pushed the price down during the session, but buyers stepped in and drove the price back up. The long wick suggests that the selling pressure is weakening, and the market could be about to turn upward.
- Shooting Star: The shooting star is a bearish reversal pattern, often seen at the top of an uptrend. It has a small body and a long upper wick, meaning that buyers pushed the price higher, but sellers took control and pulled the price back down. This can signal that the uptrend is losing momentum and a potential downtrend could follow.
- Engulfing Pattern: This is a strong reversal signal that comes in two variations:
- Bullish Engulfing: Appears at the end of a downtrend. The second candle (a green one) completely engulfs the body of the previous red candle. It signals that buyers have taken control, and a bullish reversal may follow.
- Bearish Engulfing: Appears at the end of an uptrend. The second candle (a red one) engulfs the body of the previous green candle, signaling that sellers are taking over and a bearish reversal may be coming.
- Morning Star / Evening Star: These are multi-candle patterns that signal trend reversals:
- Morning Star: Appears at the bottom of a downtrend and consists of three candles. The first is a large red candle, followed by a small-bodied candle (which could be either color, showing indecision), and then a large green candle. This pattern suggests a shift from bearish to bullish momentum.
- Evening Star: This is the opposite of the morning star, appearing at the top of an uptrend. The first is a large green candle, followed by a small indecisive candle, and then a large red candle, signaling a shift from bullish to bearish momentum.
These candlestick patterns are relatively simple to spot and can give traders an edge in anticipating market moves. However, it’s important to use them alongside other indicators or signals to confirm the trend before making trading decisions.
Using Candlestick Patterns to Improve Your Trading Strategy
Incorporating candlestick patterns into your trading strategy can be a game-changer, whether you’re day trading, swing trading, or even just observing the market. Candlestick patterns help you identify potential entry and exit points based on price action, making them valuable for timing your trades.
For day traders, candlestick patterns can provide quick insights into short-term market sentiment, helping you make decisions within a single trading session. Swing traders, on the other hand, can use these patterns to spot trend reversals over a few days or weeks, allowing for strategic position holding.
However, candlestick patterns should not be used in isolation. They are most effective when combined with other technical indicators like moving averages, which help confirm the trend direction, or volume, which indicates the strength of a price move. For example, a hammer pattern followed by an increase in volume is a stronger signal than a hammer pattern alone.
It’s also crucial to remember that candlestick patterns are just one piece of the puzzle. They have their limitations, especially in volatile or choppy markets where false signals are common. Always consider the context of the market, like current trends, economic news, and overall sentiment, before acting on a pattern.
Common Mistakes Traders Make with Candlestick Patterns
While candlestick patterns are incredibly useful, they can be misleading if not used correctly. Here are some common mistakes traders make:
- Over-relying on patterns: Candlestick patterns alone can’t guarantee success. Traders sometimes place too much trust in a pattern without considering broader market conditions or combining it with other indicators.
- Ignoring timeframes: Patterns that work on a 5-minute chart might not be as reliable on a daily chart, and vice versa. Make sure you’re using patterns in the right timeframe for your trading style.
- Forcing patterns: It’s easy to see a pattern where there isn’t one, especially when you’re eager to enter a trade. Misinterpreting a pattern can lead to poor trading decisions, so be cautious about only acting on clear, well-formed patterns.
Tips for Traders
If you’re just starting out with candlestick patterns, here are some tips to help you on your journey:
- Start with the basics: Focus on learning a few key patterns like the hammer, engulfing pattern, and doji before expanding to more advanced formations.
- Use demo accounts: Practice spotting candlestick patterns on demo accounts or charting platforms like TradingView without risking real money. This will help you build confidence before applying your skills in live markets.
- Be patient: It takes time to get comfortable with recognizing patterns and interpreting their significance. Don’t rush the learning process.
- Combine patterns with other tools: Always confirm candlestick signals with other indicators like moving averages or RSI to improve your accuracy.
- Keep a trading journal: Document the patterns you’ve identified and how they performed in real time. This will help you learn from your successes and mistakes.
Conclusion
Mastering candlestick patterns can provide you with valuable insights into market trends and potential reversals, but they are just one tool in your trading toolkit. With patience, practice, and the right strategy, these patterns can help you make more informed trading decisions.
Remember that no pattern is foolproof, and they work best when combined with other technical indicators and broader market analysis. Keep practicing, stay disciplined, and over time, you’ll find that candlestick patterns can become a key part of your trading approach. Happy trading!


