Stocks
On this page, you can find in-depth information about Stock Trading. Whether you're starting your journey with stocks or need advanced strategies for success, TradingSheets.com delivers the insights and strategies to elevate your stock trading game.
67% of retail investor accounts lose money when trading CFDs with this provider.
Introduction to Stock Trading
Stock trading is the buying and selling of shares in companies with the aim of making short-term profits. Unlike investing, where individuals buy stocks to hold them for long periods, often years or decades, stock trading focuses on capitalizing on short-term market movements. Traders may hold stocks for just minutes, hours, or days, always looking for opportunities to profit from price fluctuations.
In 2024, stock trading has evolved into a fast-paced and highly technical field, where traders rely on data, patterns, and trends to make quick decisions. One of the key tools in a trader’s arsenal is technical analysis, which helps traders predict future price movements based on historical data and market psychology, rather than traditional stock performance indicators like earnings reports or balance sheets.
Trading vs. Investing: What’s the Difference?
Investing and trading are often confused, but they are quite different strategies with distinct goals and timeframes.
| Aspect | Investing | Trading |
|---|---|---|
| Timeframe | Long-term (years to decades) | Short-term (minutes to months) |
| Goal | Build wealth gradually over time by holding stocks | Profit from short-term price movements |
| Risk Tolerance | Typically lower, with a focus on minimizing risk | Higher, with a willingness to take on more risk |
| Analysis Focus | Fundamental analysis (company financials, growth) | Technical analysis (charts, trends, patterns) |
| Approach | Buy and hold, patience is key | Buy and sell quickly, timing is critical |
Investing is about building wealth steadily over time by choosing stocks based on company performance, economic outlook, and future growth potential. Investors tend to ignore short-term price fluctuations, focusing instead on the long-term appreciation of the stock’s value.
Trading, on the other hand, is much more focused on the short term. Traders aim to make profits quickly, buying and selling based on small price changes that can happen within minutes, hours, or days. The main objective is to catch these price fluctuations and capitalize on them, requiring precise timing, speed, and a deep understanding of market trends and technical analysis.
Understanding Technical Analysis in Stock Trading
Technical analysis is a method of evaluating stocks by examining historical price movements and trading volume rather than a company’s financials. It assumes that all relevant information is already reflected in the stock’s price, and that price moves in identifiable trends that tend to repeat over time. By studying charts and past market behavior, traders try to predict where prices might go next.
Chart Patterns and Indicators
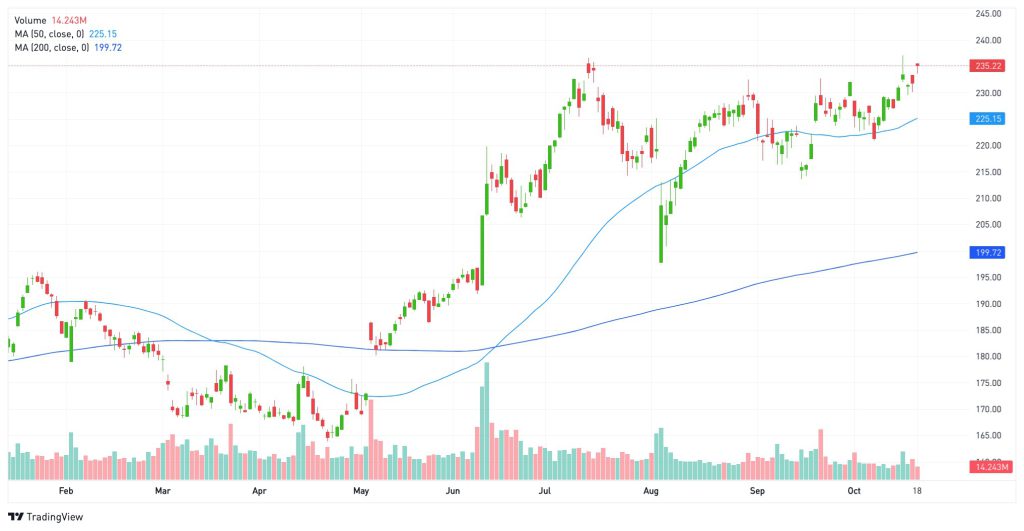
Recognizing chart patterns is a key part of technical analysis. Patterns like head and shoulders, double tops, and triangles signal potential trend reversals or continuations. For example, a double top often suggests a price peak followed by a downturn, while an ascending triangle usually points to an upcoming breakout. Flags, pennants, and the cup-and-handle pattern also give visual clues about price momentum.
Traders also use technical indicators to support their analysis. Moving averages help identify overall trends by smoothing out short-term fluctuations. Simple moving averages treat all price points equally, while exponential moving averages give more weight to recent data. These tools, combined with pattern recognition, offer a practical way to read market sentiment and time entries and exits more effectively.

Conclusion: Is Stock Trading Right for You?
Stock trading can be a rewarding but challenging endeavor. It requires a solid understanding of technical analysis, chart patterns, and market indicators to make informed decisions. Unlike long-term investing, which focuses on slow and steady growth, stock trading is fast-paced, with traders capitalizing on short-term price movements. This short-term nature demands strong discipline, emotional control, and the ability to act quickly on market trends.
If you’re someone who enjoys analyzing data, monitoring market trends, and making swift decisions, stock trading might be the right fit for you. However, it’s essential to educate yourself, practice with demo accounts, and start with smaller trades to minimize risk.
By mastering technical analysis, understanding market psychology, and implementing strong risk management strategies, you can set yourself up for success in the exciting world of stock trading.
How To Start Trading In 15 Minutes
Start Your Trading Journey with capital.com
Open a Real Money Account
Sign up with capital.com and start trading Stocks with as little as $100.
Open a Real AccountOR
Practice with a Demo Account
Not ready to trade with real money? Start practicing with capital.com’s demo account.
Open a Demo AccountCFDs are complex instruments and come with a high risk of losing money rapidly due to leverage. 67% of retail investor accounts lose money when trading CFDs with this provider. You should consider whether you understand how CFDs work and whether you can afford to take the high risk of losing your money.


